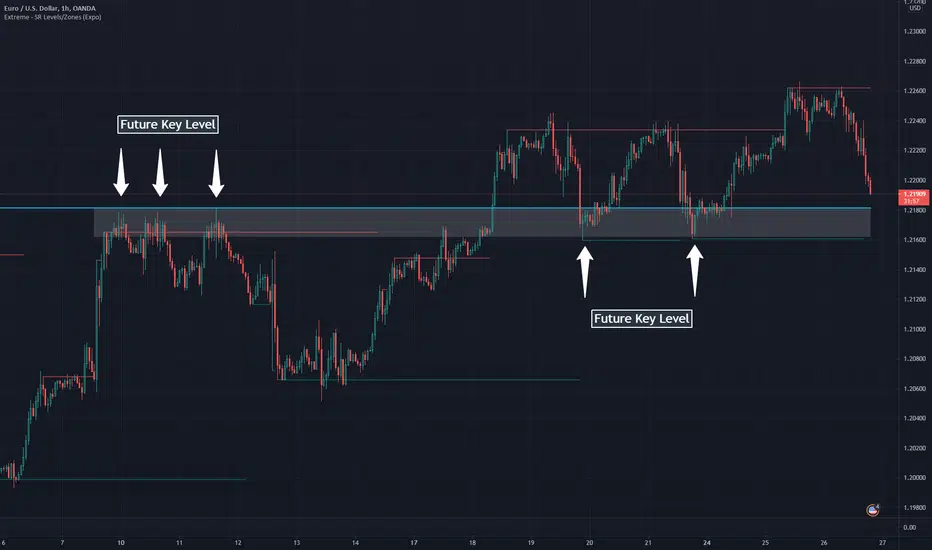
Extreme - SR Levels/Zones (Expo)Extreme - SR Levels/Zones (Expo) automatically searches and prints key support and resistance levels based on "extreme" high & low values.
When the extreme condition is met there is a high probability that the market pauses, makes a pullback, or that the trend change direction. If the current trend is strong, the price will breakout from the previous extreme level.
The indicator can be used standalone or as a part of your current trading strategy.
Real-time
No repainting
Works on any market
HOW TO USE
1. Use the indicator to identify key support and resistance levels.
2. Use the indicator to identify potential breakouts.
3. Use the indicator to identify potential reversal points.
INDICATOR IN ACTION
Daily chart
I hope you find this indicator useful , and please comment or contact me if you like the script or have any questions/suggestions for future improvements. Thanks!
I will continually work on this indicator, so please share your experience and feedback as it will enable me to make even better improvements. Thanks to everyone that has already contacted me regarding my scripts. Your feedback is valuable for future developments!
ACCESS THE INDICATOR
• Contact me on TradingView or use the links below
-----------------
Disclaimer
Copyright by Zeiierman.
The information contained in my scripts/indicators/ideas does not constitute financial advice or a solicitation to buy or sell any securities of any type. I will not accept liability for any loss or damage, including without limitation any loss of profit, which may arise directly or indirectly from the use of or reliance on such information.
All investments involve risk, and the past performance of a security, industry, sector, market, financial product, trading strategy, or individual’s trading does not guarantee future results or returns. Investors are fully responsible for any investment decisions they make. Such decisions should be based solely on an evaluation of their financial circumstances, investment objectives, risk tolerance, and liquidity needs.
My scripts/indicators/ideas are only for educational purposes!
"the script" için komut dosyalarını ara
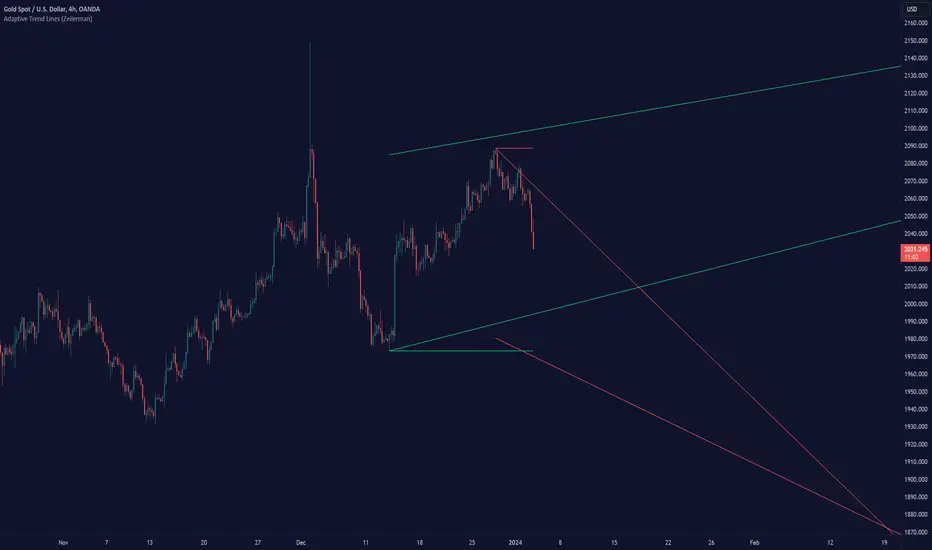
Adaptive Trend Lines (Expo)Adaptive Trend Lines (Expo) identifies the current trend direction within the selected lookback period. The idea behind the indicator is that the trend lines should self adjust to the constantly changing market. The indicator adjusts itself to the market by using tr (true range) and stdev (standard deviation) as dynamic variables.
The indicator displays positive- and negative trend channels.
HOW TO USE
1. Use the indicator to identify the trend direction.
I hope you find this indicator useful , and please comment or contact me if you like the script or have any questions/suggestions for future improvements. Thanks!
I will continually work on this indicator , so please share your experience and feedback as it will enable me to make even better improvements. Thanks to everyone that has already contacted me regarding my scripts. Your feedback is valuable for future developments!
-----------------
Disclaimer
Copyright by Zeiierman.
The information contained in my scripts/indicators/ideas does not constitute financial advice or a solicitation to buy or sell any securities of any type. I will not accept liability for any loss or damage, including without limitation any loss of profit, which may arise directly or indirectly from the use of or reliance on such information.
All investments involve risk, and the past performance of a security, industry, sector, market, financial product, trading strategy, or individual’s trading does not guarantee future results or returns. Investors are fully responsible for any investment decisions they make. Such decisions should be based solely on an evaluation of their financial circumstances, investment objectives, risk tolerance, and liquidity needs.
My scripts/indicators/ideas are only for educational purposes!
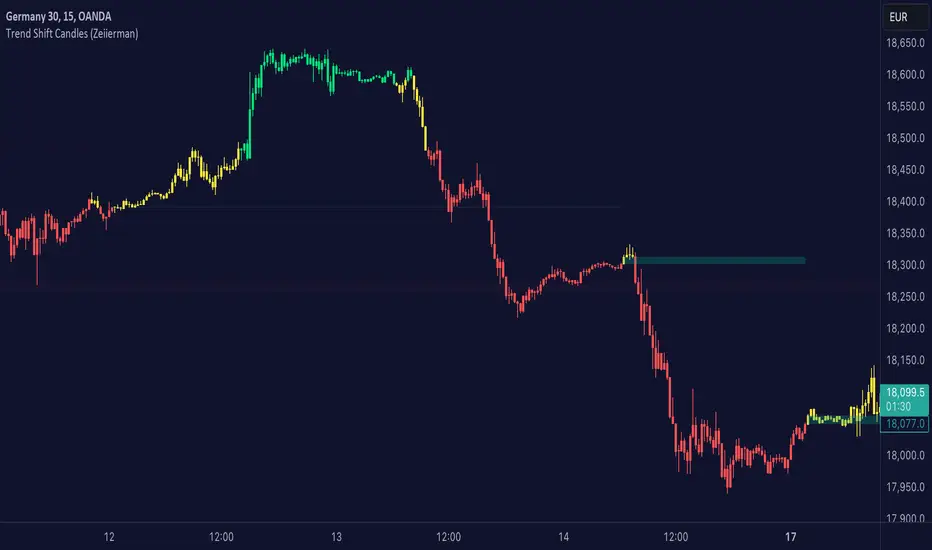
Trend shift Candles (Expo)Trend shift Candles (Expo) identifies where the market characteristics change. Trend shifts often occur in these areas. This is visualized with white candlesticks and Zones.
-> When the market enters a positive trend the candlesticks become green and when the market enters a negative trend the candlesticks become red.
-> The user can choose which timeframe to use. Vwap can be enabled as an input source instead of using price.
-> Please play around with the settings, I haven't set them to any specific values.
HOW TO USE
1. Use the indicator to identify the direction of the trend.
2. Use the indicator to identify trend changes.
-> Visual Order should be set to "Bring to Front" in order to see the color of the candles.
INDICATOR IN ACTION
4 hour chart
The indicator work on Heikin Ashi, Candles, Bars, Renko, Line Break, Kagi, and Point & Figure chart.
I hope you find this indicator useful , and please comment or contact me if you like the script or have any questions/suggestions for future improvements. Thanks!
I will continually work on this indicator, so please share your experience and feedback as it will enable me to make even better improvements. Thanks to everyone that has already contacted me regarding my scripts. Your feedback is valuable for future developments!
ACCESS THE INDICATOR
• Contact me on TradingView or use the links below
-----------------
Disclaimer
Copyright by Zeiierman.
The information contained in my scripts/indicators/ideas does not constitute financial advice or a solicitation to buy or sell any securities of any type. I will not accept liability for any loss or damage, including without limitation any loss of profit, which may arise directly or indirectly from the use of or reliance on such information.
All investments involve risk, and the past performance of a security, industry, sector, market, financial product, trading strategy, or individual’s trading does not guarantee future results or returns. Investors are fully responsible for any investment decisions they make. Such decisions should be based solely on an evaluation of their financial circumstances, investment objectives, risk tolerance, and liquidity needs.
My scripts/indicators/ideas are only for educational purposes
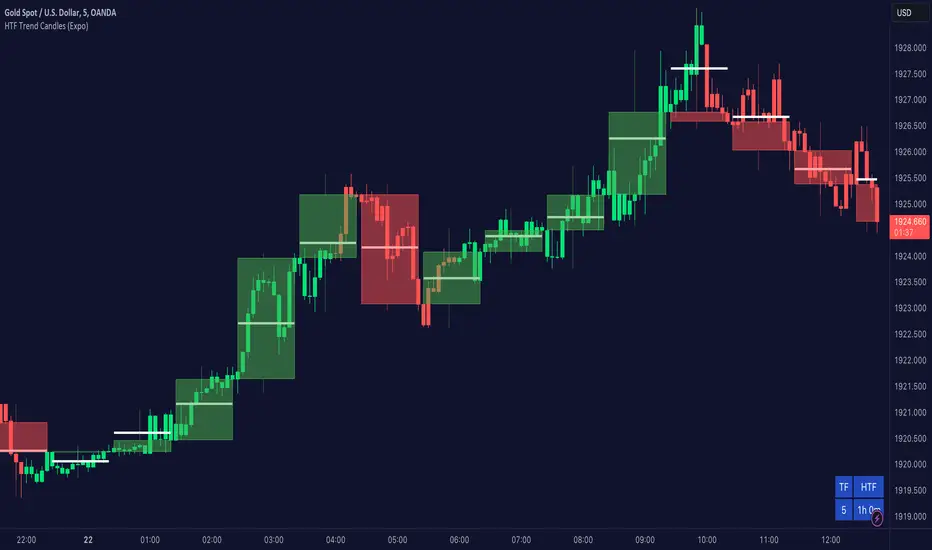
Higher TimeFrame Trend Candles (Expo) The trend is your friend!
Higher TimeFrame Candles (Expo) identifies the trend from Higher TimeFrame and displays a Zone where the trend changes. It is an effective and convenient way of getting a broader picture of the market and you will always be sure that you're trading in the same direction as the higher timeframe trend.
The user can choose which time frame to use. Heikin Ashi Trend can be displayed.
HOW TO USE
1. Use the indicator to identify the direction of the trend.
2. Use the indicator to identify trend changes.
--> Visual Order should be set to "Bring to Front" in order to see the color of the candles.
INDICATOR IN ACTION
4 hour chart
The indicator work on Heikin Ashi, Candles, Bars, Renko, Line Break, Kagi, and Point & Figure chart.
I hope you find this indicator useful , and please comment or contact me if you like the script or have any questions/suggestions for future improvements. Thanks!
I will continually work on this indicator, so please share your experience and feedback as it will enable me to make even better improvements. Thanks to everyone that has already contacted me regarding my scripts. Your feedback is valuable for future developments!
ACCESS THE INDICATOR
• Contact me on TradingView or use the links below
-----------------
Disclaimer
Copyright by Zeiierman.
The information contained in my scripts/indicators/ideas does not constitute financial advice or a solicitation to buy or sell any securities of any type. I will not accept liability for any loss or damage, including without limitation any loss of profit, which may arise directly or indirectly from the use of or reliance on such information.
All investments involve risk, and the past performance of a security, industry, sector, market, financial product, trading strategy, or individual’s trading does not guarantee future results or returns. Investors are fully responsible for any investment decisions they make. Such decisions should be based solely on an evaluation of their financial circumstances, investment objectives, risk tolerance, and liquidity needs.
My scripts/indicators/ideas are only for educational purposes
The trend changes direction.
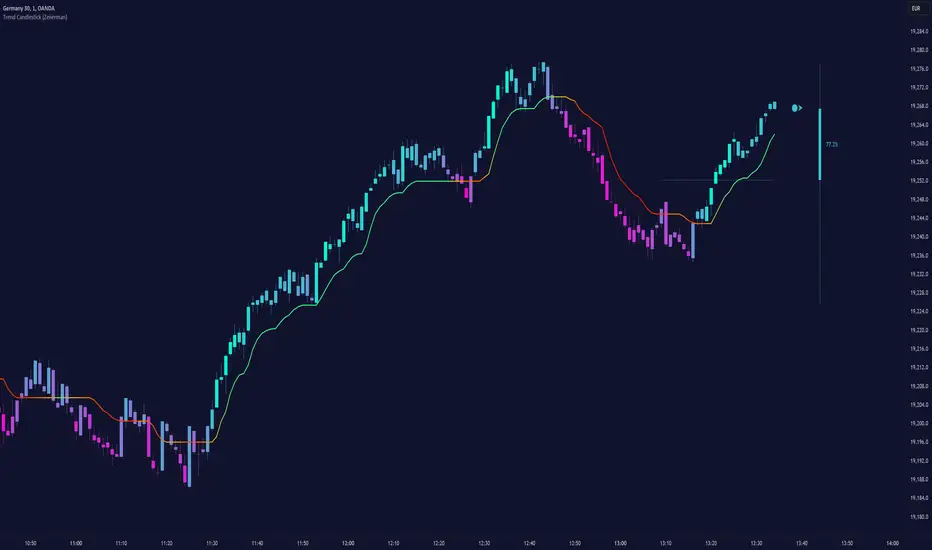
Trend Candlestick (Expo)Trading with the Trend!
Trend Candlestick (Expo) identifies the direction of the trend and Zones are displayed where the trend changes. The user has the ability to adjust the settings so that long term, as well as short term trend direction and trend changes, can be visualized.
The indicator is visual and easy to use.
HOW TO USE
1. Use the indicator to identify the direction of the trend.
2. Use the indicator to identify trend changes.
3. Use the indicator to find support and resistance levels.
--> Visual Order should be set to "Bring to Front" in order to see the color of the candles.
INDICATOR IN ACTION
15 min chart
The indicator work on Heikin Ashi, Candles, Bars, Renko, Line Break, Kagi, and Point & Figure chart.
I hope you find this indicator useful , and please comment or contact me if you like the script or have any questions/suggestions for future improvements. Thanks!
I will continually work on this indicator, so please share your experience and feedback as it will enable me to make even better improvements. Thanks to everyone that has already contacted me regarding my scripts. Your feedback is valuable for future developments!
ACCESS THE INDICATOR
• Contact me on TradingView or use the links below
-----------------
Disclaimer
Copyright by Zeiierman.
The information contained in my scripts/indicators/ideas does not constitute financial advice or a solicitation to buy or sell any securities of any type. I will not accept liability for any loss or damage, including without limitation any loss of profit, which may arise directly or indirectly from the use of or reliance on such information.
All investments involve risk, and the past performance of a security, industry, sector, market, financial product, trading strategy, or individual’s trading does not guarantee future results or returns. Investors are fully responsible for any investment decisions they make. Such decisions should be based solely on an evaluation of their financial circumstances, investment objectives, risk tolerance, and liquidity needs.
My scripts/indicators/ideas are only for educational purposes
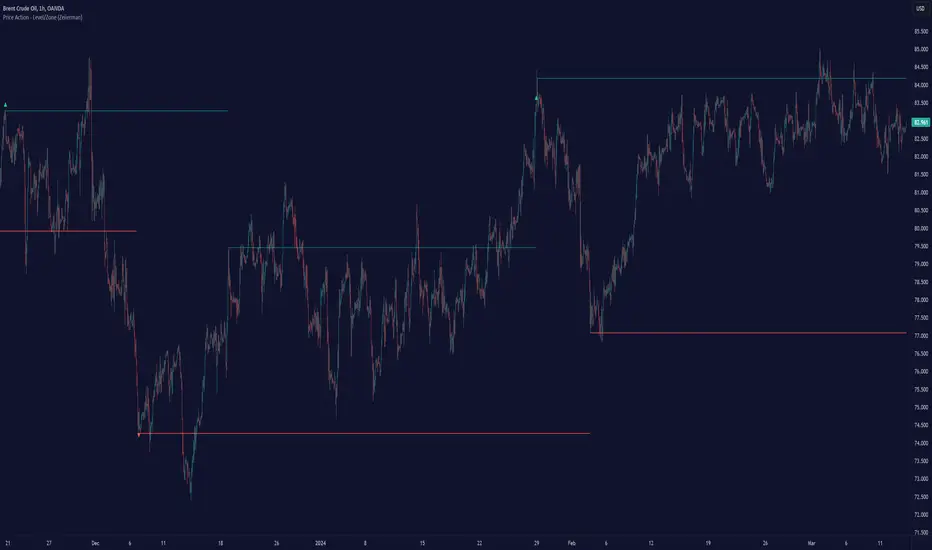
Price Action - Level/Zone (Expo)Price Action - Level/Zone (Expo) indicator identifies buying and selling pressure that has an impact on the price movement. This is visualized by a Zone, or Levels or with Barcolors depending on which settings are used.
Depending on the selected settings the indicator can identify buying and selling pressure which pushes the price further in the trend direction and it can show exhausted buyers/sellers which is seen in reversal points.
HOW TO USE
1. Use the indicator to identify buying and selling pressure.
2. Use the indicator to identify exhausted buyers and sellers.
3. Use the indicator to identify reversal points, pullbacks, or trend shifts.
4. Use the indicator to buy/short-sell breakouts of the zones.
5. Use the indicator to buy/short-sell when the price re-test the zones.
-> Try the indicator on Heikin Ashi Candles , but it works as good at any type of candlestick, bars, Renko, or line break.
INDICATOR IN ACTION
4 hour chart
4 hour chart
I hope you find this indicator useful , and please comment or contact me if you like the script or have any questions/suggestions for future improvements. Thanks!
I will continually work on this indicator, so please share your experience and feedback as it will enable me to make even better improvements. Thanks to everyone that has already contacted me regarding my scripts. Your feedback is valuable for future developments!
ACCESS THE INDICATOR
• Contact me on TradingView or use the links below
-----------------
Disclaimer
Copyright by Zeiierman.
The information contained in my scripts/indicators/ideas does not constitute financial advice or a solicitation to buy or sell any securities of any type. I will not accept liability for any loss or damage, including without limitation any loss of profit, which may arise directly or indirectly from the use of or reliance on such information.
All investments involve risk, and the past performance of a security, industry, sector, market, financial product, trading strategy, or individual’s trading does not guarantee future results or returns. Investors are fully responsible for any investment decisions they make. Such decisions should be based solely on an evaluation of their financial circumstances, investment objectives, risk tolerance, and liquidity needs.
My scripts/indicators/ideas are only for educational purposes!
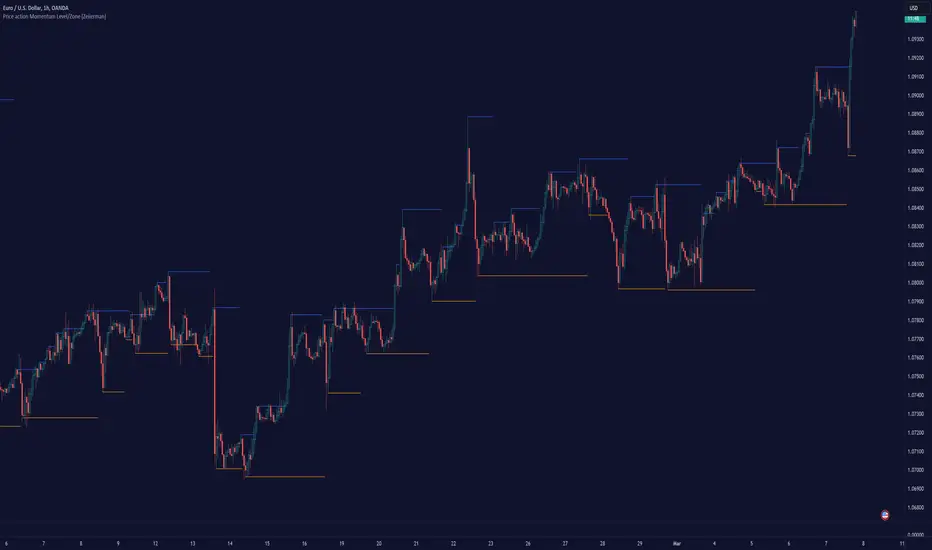
Price action Momentum Level/Zone (Expo) Price action Momentum Levels/Zones (Expo) indicator identifies relatively stronger Up and Down Momentum. This is visualized by a Zone, or Levels or with Barcolors depending on which settings are used.
When the market has relatively stronger momentum it can be a sign that the sellers or buyers are exhausted and the market has to pause, make a pullback, or make a trend shift.
HOW TO USE
1. Use the indicator to identify relatively stronger momentum.
2. Use the indicator to identify pullbacks or trend shifts.
3. Use the indicator to buy/short-sell breakouts of the zones.
4. Use the indicator to buy/short-sell when the price re-test the zones.
INDICATOR IN ACTION
4 hour chart
I hope you find this indicator useful , and please comment or contact me if you like the script or have any questions/suggestions for future improvements. Thanks!
I will continually work on this indicator, so please share your experience and feedback as it will enable me to make even better improvements. Thanks to everyone that has already contacted me regarding my scripts. Your feedback is valuable for future developments!
ACCESS THE INDICATOR
• Contact me on TradingView or use the links below
-----------------
Disclaimer
Copyright by Zeiierman.
The information contained in my scripts/indicators/ideas does not constitute financial advice or a solicitation to buy or sell any securities of any type. I will not accept liability for any loss or damage, including without limitation any loss of profit, which may arise directly or indirectly from the use of or reliance on such information.
All investments involve risk, and the past performance of a security, industry, sector, market, financial product, trading strategy, or individual’s trading does not guarantee future results or returns. Investors are fully responsible for any investment decisions they make. Such decisions should be based solely on an evaluation of their financial circumstances, investment objectives, risk tolerance, and liquidity needs.
My scripts/indicators/ideas are only for educational purposes!
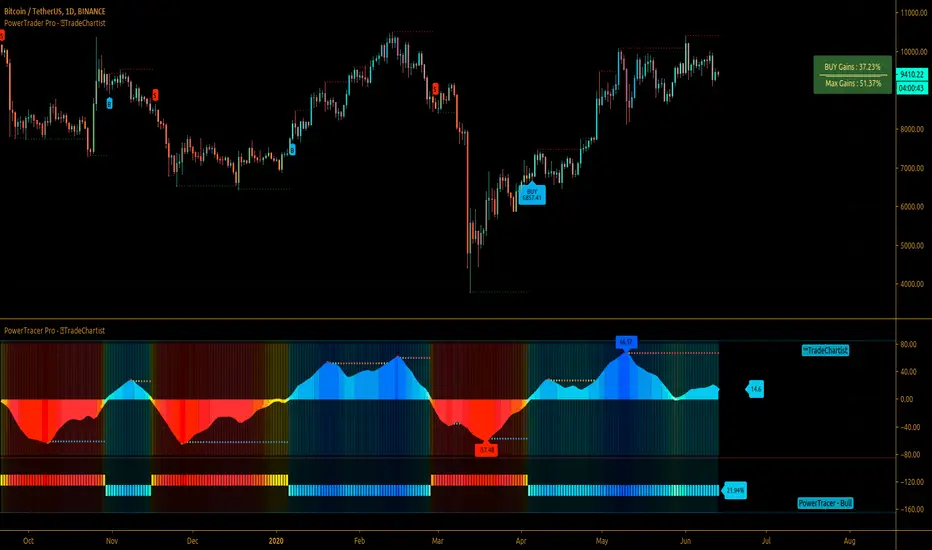
TradeChartist PowerTracer ProTradeChartist PowerTracer Pro is an exceptionally well designed and a functional indicator, requiring minimal user input to trace the asset's Bull and Bear Power. The indicator makes it visually engaging with its intelligent positioning of the PowerTracer Bar, tracking not just the current trend, but also the developing trend using visually easy to understand Power plots. PowerTracer Pro can be used with PowerTrader Pro to generate Trade signals with several possible combinations of settings based on PowerTracer Pro Backtester Performance results.
What does ™TradeChartist PowerTracer Pro do?
1. Tracks Bull and Bear Power and plots the information visually on chart using one of the following 2 Power plot options based on Timeframe Multiplier and Smoothing Factor..
𝗣𝗼𝘄𝗲𝗿𝗧𝗿𝗮𝗰𝗲𝗿 - Plot of the Bull and Bear Power Oscillator, pivotal to this script that tracks the true Bull and Bear Power along with Bull/Bear oscillator reading, calculated dynamically using a unique and original formula. Values beyond 50 and -50 are quite rare, but theoretically, they can go beyond 80 and -80. 𝗣𝗼𝘄𝗲𝗿𝗧𝗿𝗮𝗰𝗲𝗿's highs and lows are also tracked and updated real-time using labels placed exactly at the Highs and Lows with their readings.
Bar-wise Power Holder - Absolute Bull and Bear power of each bar. It is plotted by calculating the difference between Bull and Bear Power of each bar. The values can swing between -100 and +100 even though values above 90 and below 90 are rare.
2. Visually displays the Balance of Power between the Bulls and the Bears using Power density background fill.
3. Uses an accompanying 𝗣𝗼𝘄𝗲𝗿𝗧𝗿𝗮𝗰𝗲𝗿 bar that helps spot the true bull and bear power using simple linear blocks, displaying the power level using power intensity colors.
4. Paints price bars and PowerTracer background using Power intensity colors, which helps spot the increase or decrease in Bull and Bear Power. Price bar color changes are based on increasing/decreasing power intensity of the price bar's power holder and may not be the same as the Power plots. This is designed specifically to spot price trends based on chart timeframe power trend.
5. Inverts bar colors, and PowerTracer bar color to help see price trend using the Opponent's Point of View.
What markets can this indicator be used on?
-- Forex
-- Stocks - works best with 4hr or above and prices calculated taking gaps into account.
-- Commodities
-- Cryptocurrencies
and almost any asset on Trading View
What time-frames can this indicator be used on?
This indicator can be used on all timeframes. If the asset has very little volume / volatility or is far low in comparative value against the base currency, power detection can be choppy, but with most assets, this won't be an issue.
Does this indicator repaint?
-- No. Real-time Power plots can change colors and values based on current bar close as values get calculated dynamically. Once the bar closes, plots and power intensity colors don't repaint.
-- This can be verified using Bar Replay to check if the plots and fills stay in the same bar in real time as the Bar Replay
Does the indicator generate trade signals based on Power shifts?
Yes. PowerTracer Pro can be connected to PowerTrader Pro to generate BUY and SELL signals with automatic/user specified targets on the main price chart along with Fixed or Trailing Stop Loss plots based on the Power Plot opted by the user. PowerTrader Pro is highly recommended for traders who would like signals based on power trend on the main price chart as it comes with real time Dashboard and Gains tracker with the option to plot past performance displaying Max gains and Max Drawdowns for each trade. It also includes SL/TP Plots and Alerts system that can be used to automate trades based on settings that result in high ROI on PowerTracer Pro Backtester performance report.
The charts below show how this indicator can be used with PowerTrader Pro to generate trade signals with TP and SL plots.
GBP-USD 1hr chart with SL and TP plots with real-time gains tracker. Timeframe MUltiplier - 2, Smoothing Factor - 8
LINK-BTC 4hr chart with SL and TP plots, real-time gains tracker and past performance results. Timeframe Multiplier - 3, Smoothing Factor - 1
XAU-USD Gold 1hr chart with SL and TP plots, real-time gains on Dashboard with Automatic Targets and past performance labels. Timeframe Multiplier - 2, Smoothing Factor - 1
===================================================================================================================
This is not a free to use indicator. Get in touch with me (PM me directly if you would like trial access to test the indicator)
Premium Scripts - Trial access and Information
Trial access offered on all Premium scripts.
PM me directly to request trial access to the scripts or for more information.
===================================================================================================================
[BT] - ScalpMaster [ALERTS] v1Go easy on this script as it's my first, hopefully more to come!
ScalpMaster - V1
It's main feature is catch a bull run for volatile markets. Two main selling triggers (CCI and TSSL) with an option to only sell after fees are met (for profit).
Built in Statistics and Back-testing
I've introduced my own version of backtesting built into the main script. You can disable it if it's too much, just makes it easier to dial the settings in and compare with alert triggering. I've included this on all of my scripts.
***You will get a warning that this script repaints, however you can easily compare alerts against the labels. I'm not entirely sure, but I believe the repainting is due to the Global Stats Label at the end gets repainted to keep in the front. ***
Directions
Buy: When dialing in the script, watch the purple line above the source, when the current price crosses above this purple line then the buying trigger sets.
Sell: TSSL - Trailing Stop / Stop Limit, use available settings to manipulate behavior. It's meant to trail the bull run and sell once the price crosses the bottom tssl bar
Sell: CCI - Modify the FastMA and SlowMA settings
Sell: P+ - Above won't trigger until you are in the positive after the fees x2 are met. Great to keep your losses minimal. Combine this with a high Stop Loss for great results but might be waiting awhile for a profit.

Exhausted Volume (Expo)Exhausted Volume (Expo)
DESCRIPTION
Exhausted Volume (Expo) indicator visualize exhausted volume. Exhaustion often signals the reversal of a current trend because it illustrates excess levels of supply or demand, indicating a market is either overbought or oversold.
The indicator can also be used to detect volume pressure in either direction which can occur in breakouts or in reversal points. The input variable ‘Volume Length’ can be changed. A longer Volume length means that the indicator detects bolder exhausted volume.
• Volume pressure is seen in reversal points.
• Volume pressure can be seen in breakouts.
The indicator is also equipped with exhausted volume signals that are more sensitive. This is visualized with arrows up and down. The investor has the ability to adjust the sensitivity of these signals.
HOW TO USE
1. Use the indicator to identify exhausted volume
2. Use the indicator to identify volume pressure.
3. Use the indicator to identify reversal points.
4. Use the indicator to identify breakouts.
Combine the indicator with ‘ Climax Volume (Expo) ’
INDICATOR IN ACTION
EURUSD
EURUSD
BTCUSD
BTCUSD
The indicator works with RENKO, HEIKIN ASHI and with KAGI charts as well.
I hope you find this indicator useful, and please comment or contact me if you like the script or have any questions/suggestions for future improvements. Thanks!
I will continue to work on this indicator, so please share your experience and feedback with me so that I can continuously improve it. Thanks to everyone that have contacted me regarding my scripts. Your feedback is valuable for future developments!
ACCESS THE INDICATOR
• Contact me on TradingView or use the links below
-----------------
Disclaimer
Copyright by Zeiierman.
The information contained in my scripts/indicators/ideas does not constitute financial advice or a solicitation to buy or sell any securities of any type. I will not accept liability for any loss or damage, including without limitation any loss of profit, which may arise directly or indirectly from use of or reliance on such information.
All investments involve risk, and the past performance of a security, industry, sector, market, financial product, trading strategy, or individual’s trading does not guarantee future results or returns. Investors are fully responsible for any investment decisions they make. Such decisions should be based solely on an evaluation of their financial circumstances, investment objectives, risk tolerance, and liquidity needs.
My scripts/indicators/ideas are only for educational purposes!

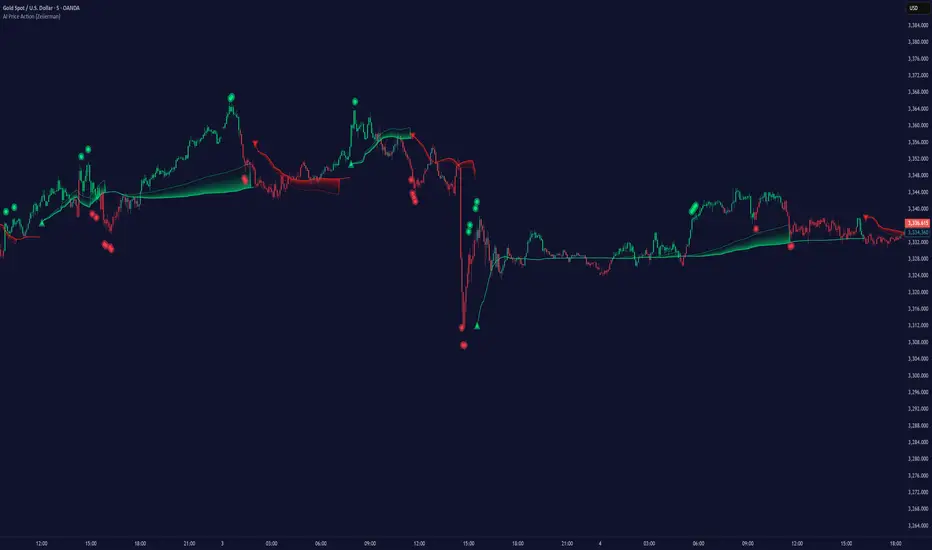
Intelligent Price Action - Movement Up (Expo)Intelligent Price Action - Movement Up (Expo)
DESCRIPTION
Intelligent Price Action - Movement Up (Expo) identifies important up movements that have an impact on current price characteristics. The indicator is visualizing buying pressure! These price patterns are valuable insight when trading the market.
This indicator response faster to price movement and is more focused on detecting buying pressure rather than exhausted buyers.
• Buying pressure is seen in reversal points.
• Buying pressure can be seen when the buyers are exhausted.
• Buying pressure can be seen in positive breakouts.
HOW TO USE
1. Use the indicator to identify buying pressure.
2. Use the indicator to identify reversal points.
3. Use the indicator to identify exhausted buyers.
4. Use the indicator to identify breakouts.
Combine the indicator with ‘ Intelligent Price Action - Movement Down (Expo) ’ or with my other Price Action indicators.
INDICATOR IN ACTION
EURUSD
BTCUSD
BTCUSD
GOLD
WALL STREET
WALL STREET
BTCUSD
EURUSD
The indicator works with RENKO, HEIKIN ASHI and with KAGI charts as well.
I hope you find this indicator useful , and please comment or contact me if you like the script or have any questions/suggestions for future improvements. Thanks!
I will continue to work on this indicator, so please share your experience and feedback with me so that I can continuously improve it. Thanks to everyone that have contacted me regarding my scripts. Your feedback is valuable for future developments!
ACCESS THE INDICATOR
• Contact me on TradingView or use the links below
-----------------
Disclaimer
Copyright by Zeiierman.
The information contained in my scripts/indicators/ideas does not constitute financial advice or a solicitation to buy or sell any securities of any type. I will not accept liability for any loss or damage, including without limitation any loss of profit, which may arise directly or indirectly from use of or reliance on such information.
All investments involve risk, and the past performance of a security, industry, sector, market, financial product, trading strategy, or individual’s trading does not guarantee future results or returns. Investors are fully responsible for any investment decisions they make. Such decisions should be based solely on an evaluation of their financial circumstances, investment objectives, risk tolerance, and liquidity needs.
My scripts/indicators/ideas are only for educational purposes!
Intelligent Price Action - Movement Down (Expo)Intelligent Price Action - Movement Down (Expo)
DESCRIPTION
Intelligent Price Action - Movement Down (Expo) identifies important down movements that have an impact on current price characteristics. The indicator is visualizing selling pressure! These price patterns are valuable insight when trading the market.
This indicator response faster to price movement and is more focused on detecting selling pressure rather than exhausted sellers.
• Selling pressure is seen in reversal points.
• Selling pressure can be seen when the sellers are exhausted.
• Selling pressure can be seen in negative breakouts.
HOW TO USE
1. Use the indicator to identify selling pressure.
2. Use the indicator to identify reversal points.
3. Use the indicator to identify exhausted sellers.
4. Use the indicator to identify breakouts.
Combine the indicator with ‘ Intellilligent Price Action - Movement Up (Expo) ’ or with my other Price Action indicators.
INDICATOR IN ACTION
EURUSD
EURUSD
BTCUSD
BTCUSD
GOLD
WALL STREET
WALL STREET
EURUSD
BTCUSD
BRENT
The indicator works with RENKO, HEIKIN ASHI and with KAGI charts as well.
I hope you find this indicator useful , and please comment or contact me if you like the script or have any questions/suggestions for future improvements. Thanks!
I will continue to work on this indicator, so please share your experience and feedback with me so that I can continuously improve it. Thanks to everyone that have contacted me regarding my scripts. Your feedback is valuable for future developments!
ACCESS THE INDICATOR
• Contact me on TradingView or use the links below
-----------------
Disclaimer
Copyright by Zeiierman.
The information contained in my scripts/indicators/ideas does not constitute financial advice or a solicitation to buy or sell any securities of any type. I will not accept liability for any loss or damage, including without limitation any loss of profit, which may arise directly or indirectly from use of or reliance on such information.
All investments involve risk, and the past performance of a security, industry, sector, market, financial product, trading strategy, or individual’s trading does not guarantee future results or returns. Investors are fully responsible for any investment decisions they make. Such decisions should be based solely on an evaluation of their financial circumstances, investment objectives, risk tolerance, and liquidity needs.
My scripts/indicators/ideas are only for educational purposes!

Intelligent Price Action - Positive Close (Expo)Intelligent Price Action - Positive Close (Expo)
DESCRIPTION
Intelligent Price Action - Positive Close (Expo) identifies important positive closes that have an impact on current price characteristics. The indicator is visualizing buying pressure! These price patterns are valuable insight when trading the market.
• Buying pressure is seen in reversal points.
• Buying pressure can be seen when the buyers are exhausted.
• Buying pressure can be seen in positive breakouts.
HOW TO USE
1. Use the indicator to identify buying pressure.
2. Use the indicator to identify reversal points.
3. Use the indicator to identify exhausted buyers.
4. Use the indicator to identify breakouts.
Combine the indicator with ‘I ntellilligent Price Action - Negative Close (Expo) ’ or with my other Price Action indicators.
INDICATOR IN ACTION
EURUSD
EURUSD
BTCUSD
BRENT
WALL STREET
WALL STREET
WALL STREET
BTCUSD
BTCUSD
EURUSD
EURUSD
The indicator works with RENKO, HEIKIN ASHI and with KAGI charts as well.
I hope you find this indicator useful , and please comment or contact me if you like the script or have any questions/suggestions for future improvements. Thanks!
I will continue to work on this indicator, so please share your experience and feedback with me so that I can continuously improve it. Thanks to everyone that have contacted me regarding my scripts. Your feedback is valuable for future developments!
ACCESS THE INDICATOR
• Contact me on TradingView or use the links below
-----------------
Disclaimer
Copyright by Zeiierman.
The information contained in my scripts/indicators/ideas does not constitute financial advice or a solicitation to buy or sell any securities of any type. I will not accept liability for any loss or damage, including without limitation any loss of profit, which may arise directly or indirectly from use of or reliance on such information.
All investments involve risk, and the past performance of a security, industry, sector, market, financial product, trading strategy, or individual’s trading does not guarantee future results or returns. Investors are fully responsible for any investment decisions they make. Such decisions should be based solely on an evaluation of their financial circumstances, investment objectives, risk tolerance, and liquidity needs.
My scripts/indicators/ideas are only for educational purposes!

Trend Scalper (Expo)Trend Scalper (Expo)
DESCRIPTION
Trend Scalper (Expo) is a Scalping strategy based on RSI, Stochastic and moving averages techniques. The idea is to visualize scalping opportunities in trends.
The trend is determined by the color of the moving average called ‘TrendHolder’ The ‘Trendholer’ consists of 3 colors, green, red and orange. Green is a positive trend, red is a negative trend and orange is a neutral or no trend.
Scalping opportunities are visualized by the circles and the triangles. The circles are based on RSI calculation. The triangles are based on Stochastic calculation.
- If there is a green circle and a green triangle and ‘Trendholder’ is orange or green, Enter Long!
- If there is a red circle and a red triangle and ‘Trendholder’ is orange or red, Enter Short!
Combine the indicator with HEIKIN ASHI candlesticks.
HOW TO USE
1. Use the indicator to find scalping opportunities in trends.
I NDICATOR IN ACTION
BTCUSD
EURUSD
GOLD
The indicator works with RENKO, HEIKIN ASHI and with KAGI charts as well.
I hope you find this indicator useful, and please comment or contact me if you like the script or have any questions/suggestions for future improvements. Thanks!
I will continue to work on this indicator, so please share your experience and feedback with me so that I can continuously improve it. Thanks to everyone that have contacted me regarding my scripts. Y our feedback is valuable for future developments!
ACCESS THE INDICATOR
• Contact me on TradingView or use the links below
-----------------
Disclaimer
Copyright by Zeiierman.
The information contained in my scripts/indicators/ideas does not constitute financial advice or a solicitation to buy or sell any securities of any type. I will not accept liability for any loss or damage, including without limitation any loss of profit, which may arise directly or indirectly from use of or reliance on such information.
All investments involve risk, and the past performance of a security, industry, sector, market, financial product, trading strategy, or individual’s trading does not guarantee future results or returns. Investors are fully responsible for any investment decisions they make. Such decisions should be based solely on an evaluation of their financial circumstances, investment objectives, risk tolerance, and liquidity needs.
My scripts/indicators/ideas are only for educational purposes!

TTTT Trend (Expo)TTTT Trend (Expo)
DESCRIPTION
TTTT Trend (Expo) indicator is designed to visualize negative trends. Negative trends are often categorized with higher volatility and thus the price can change dramatically over a short period in either direction. The indicator detects these price fluctuations and visualizes it with a red cloud. So the trend is negative as long as the indicator has a red cloud. Respectively, if the indicator has no red cloud it’s a sign that the trend is positive.
The TTTT Trend (Expo) comes with 3 trend layers that have different sensitivity and can be enabled or disable.
HOW TO USE
1. Use the indicator to visualize negative trends.
2. Use the indicator to visualize positive trends.
INDICATOR IN ACTION
EURUSD
EURUSD
BTCUSD
BTCUSD
WALL STREET
EURGBP
The indicator works with RENKO, HEIKIN ASHI and with KAGI charts as well.
I hope you find this indicator useful, and please comment or contact me if you like the script or have any questions/suggestions for future improvements. Thanks!
I will continue to work on this indicator, so please share your experience and feedback with me so that I can continuously improve it. Thanks to everyone that have contacted me regarding my scripts. Your feedback is valuable for future developments!
ACCESS THE INDICATOR
• Contact me on TradingView or use the links below
-----------------
Disclaimer
Copyright by Zeiierman.
The information contained in my scripts/indicators/ideas does not constitute financial advice or a solicitation to buy or sell any securities of any type. I will not accept liability for any loss or damage, including without limitation any loss of profit, which may arise directly or indirectly from use of or reliance on such information.
All investments involve risk, and the past performance of a security, industry, sector, market, financial product, trading strategy, or individual’s trading does not guarantee future results or returns. Investors are fully responsible for any investment decisions they make. Such decisions should be based solely on an evaluation of their financial circumstances, investment objectives, risk tolerance, and liquidity needs.
My scripts/indicators/ideas are only for educational purposes!

Trend analysis - Take Profit (Expo)Trend analysis - Take Profit (Expo)
DESCRIPTION
Trend analysis - Take Profit (Expo) indicator is developed to visualize ‘Lock In Profits -points' in trends. It’s a necessity for a professional trader to continuously ‘Lock In Profit’ in order to grow their balance and to reduce their risk. In fact, research shows that exits have more impact on the results than any other factor (Tharp, 2006). So when the indicator shows a ‘TP’ - point, start to lock in some of your profit and continuously do so on every TP - point and exit the trade when a circle is shown.
The indicator does also visualizes the current trend by the color of the cloud. Green color = positive trend. Red color = negative trend.
The professional trader will have the possibility to adjust the sensitivity of the TP - point as well as the length of the trend calculation.
HOW TO USE
1. Use this indicator to identify when to Lock In Profits in trends.
2. Use the indicator to identify trends.
3. Use the indicator to identify a trend shift.
INDICATOR IN ACTION
BTCUSD
BTCUSD
EURUSD
BRENT
EURGBP
The indicator works with RENKO, HEIKIN ASHI and with KAGI charts as well.
I hope you find this indicator useful, and please comment or contact me if you like the script or have any questions/suggestions for future improvements. Thanks!
I will continue to work on this indicator, so please share your experience and feedback with me so that I can continuously improve it. Thanks to everyone that have contacted me regarding my scripts. Your feedback is valuable for future developments!
ACCESS THE INDICATOR
• Contact me on TradingView or use the links below
-----------------
Disclaimer
Copyright by Zeiierman.
The information contained in my scripts/indicators/ideas does not constitute financial advice or a solicitation to buy or sell any securities of any type. I will not accept liability for any loss or damage, including without limitation any loss of profit, which may arise directly or indirectly from use of or reliance on such information.
All investments involve risk, and the past performance of a security, industry, sector, market, financial product, trading strategy, or individual’s trading does not guarantee future results or returns. Investors are fully responsible for any investment decisions they make. Such decisions should be based solely on an evaluation of their financial circumstances, investment objectives, risk tolerance, and liquidity needs.
My scripts/indicators/ideas are only for educational purposes!

Adaptive Trend (Expo)Adaptive Trend (Expo)
DESCRIPTION
This Adaptive Trend (Expo) indicator is used to detect trends as well as to adapt to the trend characteristic in order to filter-out trend noise. Having an indicator like this enables professional traders to stay longer in trends. The indicator is also equipped with upper- and lower boundaries as well as a mid-line.
Positive trend
If the two trendlines (positive & negative trendline) emerges into one single line, it’s regarded as a positive trend. If a green cloud is painted in the indicator it’s a sign that the indicator is categorizing that price move as noise, and thus the professional trader should keep their long position, or enter Long.
Negative trend
If the two trendlines (positive & negative trendline) separates and become two lines as well as a red cloud is painted in the indicator, this is regarded as a negative trend.
As a general rule, if the ‘positive & negative trendline’ is above the midline there is a positive trend. If the ‘positive & negative trendline’ is below the midline there is a negative trend.
You have the possibility to change the ‘trendvalue’, a shorter length is more sensitive than a longer length.
HOW TO USE
1. Use the indicator to identify trends.
2. Use the indicator as a trend following strategy.
INDICATOR IN ACTION
EURUSD
EURUSD
EURUSD
BTCUSD
The indicator works with RENKO, HEIKIN ASHI and with KAGI charts as well.
I hope you find this indicator useful, and please comment or contact me if you like the script or have any questions/suggestions for future improvements. Thanks!
I will continue to work on this indicator, so please share your experience and feedback with me so that I can continuously improve it. Thanks to everyone that have contacted me regarding my scripts. Your feedback is valuable for future developments!
ACCESS THE INDICATOR
• Contact me on TradingView or use the links below
-----------------
Disclaimer
Copyright by Zeiierman.
The information contained in my scripts/indicators/ideas does not constitute financial advice or a solicitation to buy or sell any securities of any type. I will not accept liability for any loss or damage, including without limitation any loss of profit, which may arise directly or indirectly from use of or reliance on such information.
All investments involve risk, and the past performance of a security, industry, sector, market, financial product, trading strategy, or individual’s trading does not guarantee future results or returns. Investors are fully responsible for any investment decisions they make. Such decisions should be based solely on an evaluation of their financial circumstances, investment objectives, risk tolerance, and liquidity needs.
My scripts/indicators/ideas are only for educational purposes!

Extremes (Expo) Extremes (Expo)
DESCRIPTION
This Extreme (Expo) indicator identifies areas where the market is extreme. The length of the extreme calculation can be changed and gives you the flexibility to choose how sensitive the indicator should be. A longer length means that the indicator only identifies bold extremes. A shorter length is more sensitive and thus identifies all extremes in the market.
When the market is in an extreme mode, keep your trade until the extreme mode ends.
Postive extreme is when the price is above the positive extreme lines. (Keep your long trade until the positive extreme ends).
Negative extreme is when the price is below the negative extreme lines. (Keep your short trade until the negative extreme ends).
The Extremes (Expo) can be used to visualize the trend. Price crossing indicates a directional change. Price can also bounce off the extremes lines, which can act as dynamic support and resistance. It is often used in combination with other signals and analysis techniques.
TREND
The indictor has a Trend- feature that can be switched on which identifies trend shifts as well as trend direction.
A positive trend is when all three trendlines are green, and when the price is at least above one of these three lines.
A Negative trend is when all three trendlines are red, and when the price is at least under one of these three lines.
When the color of the trend lines changes color it indicates that the trend might shift direction. When all three trendlines have shifted color a trend is established.
PULLBACK
A bonus feature that is added to the trend-setting is that it can detect pullbacks in trends. This is visualized by that one of the three trendlines change color. For instance, say that all 3 lines are red (negative trend) and one of these lines changes color to green it can be regarded as a pullback in the negative trend.
HOW TO USE
1. Use the indicator to identify extreme areas.
2. Use the indicator to identify trends.
3. Use the indicator to identify trend shifts.
4. Use the indicator to identify pullbacks in trends.
INDICATOR IN ACTION
EXTREMES
BTCUSD
BTCUSD
TESLA
WALL STREET
TREND & PULLBACK
WALL STREET
EURUSD
I hope you find this indicator useful , and please comment or contact me if you like the script or have any questions/suggestions for future improvements. Thanks!
I will continue to work on this indicator, so please share your experience and feedback with me so that I can continuously improve it. Thanks to everyone that have contacted me regarding my scripts. Your feedback is valuable for future developments!
ACCESS THE INDICATOR
• Contact me on TradingView or use the links below
-----------------
Disclaimer
Copyright by Zeiierman.
The information contained in my scripts/indicators/ideas does not constitute financial advice or a solicitation to buy or sell any securities of any type. I will not accept liability for any loss or damage, including without limitation any loss of profit, which may arise directly or indirectly from use of or reliance on such information.
All investments involve risk, and the past performance of a security, industry, sector, market, financial product, trading strategy, or individual’s trading does not guarantee future results or returns. Investors are fully responsible for any investment decisions they make. Such decisions should be based solely on an evaluation of their financial circumstances, investment objectives, risk tolerance, and liquidity needs.
My scripts/indicators/ideas are only for educational purposes!

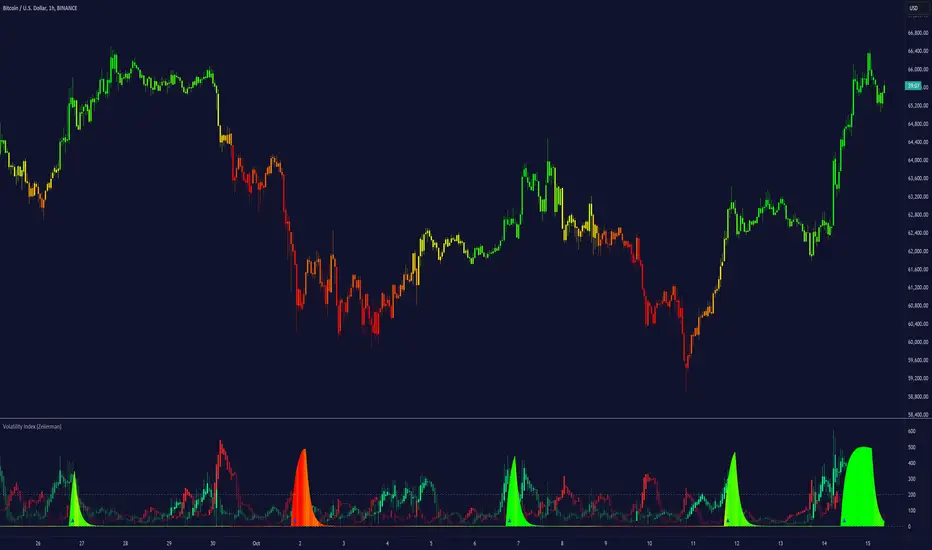
Volatility Index (Expo)Volatility Index (Expo)
DESCRIPTION
Volatility can be referred to many things, but a commonly accepted definition of volatility is that it’s a measure of the risk or uncertainty in the market. Higher volatility is equal to more risk in the market. A simple way of describing it is that when volatility is high, the value of the market can be spread out over a larger range of values. This means that the price of the market can change dramatically over a short time period in either direction. A lower volatility means that a market's value does not fluctuate dramatically, and tends to be steadier. However, how to calculate and to apply volatility has been widely debated and many different calculations have been used. Volatility Index is a must for a professional trader in today's volatile markets.
This Volatility Index is derived from research within Volatility.
HOW TO USE
1. Use the indicator to detect low- respectively high volatility.
2. Enter the market when the volatility is low, and exit the market when the volatility is high.
3. Use the indicator to identify when the volatility peaks. Can indicate that the market will shift or can be good areas to take profits.
Trend
When the market is in a positive trend, the volatility is low and stable. The opposite happens when the market is in a negative trend, the volatility is high and price moves boldly.
As a rule ,when volatility increases unusually(abnormal) in relation to previous periods something is happening in the market, then wait until the volatility peaks or when the indicator does not make any new highs (the indicator becomes flat), and in conjunction with that the trending price action doesn’t make any new lows or respectively highs. When this happens there is a high probability that the market will take a temporary turn.
Positive volatility refers to when the volatility index increases with green candlesticks this means that the buyers are more aggressive than sellers. (Can indicate a trend change)
Negative volatility refers to when the volatility index increases with red candlesticks this means that the sellers are more aggressive than buyers. (Can indicate a trend change)
INDICATOR IN ACTION
This indicator is best presented live, the graphs below gives a hint of how the Volatility Index works.
The indicator works on any market, security, currency, stock, etc. and on any timeframe.
BTCUSD
EURUSD
WALL STREET
I hope you find this indicator useful , and please comment or contact me if you like the script or have any questions/suggestions for future improvements. Thanks!
I will continue to work on this indicator, so please share your experience and feedback with me so that I can continuously improve it. Thanks to everyone that have contacted me regarding my scripts. Your feedback is valuable for future developments!
ACCESS THE INDICATOR
• Contact me on TradingView or use the links below
-----------------
Disclaimer
Copyright by Zeiierman.
The information contained in my scripts/indicators/ideas does not constitute financial advice or a solicitation to buy or sell any securities of any type. I will not accept liability for any loss or damage, including without limitation any loss of profit, which may arise directly or indirectly from use of or reliance on such information.
All investments involve risk, and the past performance of a security, industry, sector, market, financial product, trading strategy, or individual’s trading does not guarantee future results or returns. Investors are fully responsible for any investment decisions they make. Such decisions should be based solely on an evaluation of their financial circumstances, investment objectives, risk tolerance, and liquidity needs.
My scripts/indicators/ideas are only for educational purposes!
Intelligent Trend (Expo)Intelligent Trend - (Expo)
DESCRIPTION
The Intelligent Trend is a powerful trend visualizing tool with real-time decision points. The indicator analyzes the current trend and identifying areas where a new decision should be made. These points will appear in pullbacks or where the market will change. The trader should always make a new decision on these points.
You can switch on the "long-term Trend", which is an incredible good way to visualize the long-term trend. Otherwise, the recommended settings for the indicator is a length of 75- 200.
HOW TO USE
1. Use the indicator to visualize trends.
2. Use the indicator to identify real-time decision points in the market.
INDICATOR IN ACTION
APPLE
BTCUSD
BTCUSD
BRENT
AMZN
EURUSD
EURUSD
I hope you find this indicator useful, and please comment or contact me if you like the script or have any questions/suggestions for future improvements. Thanks!
I will continue to work on this indicator, so please share your experience and feedback with me so that I can continuously improve it. Thanks to everyone that have contacted me regarding my scripts. Your feedback is valuable for future developments!
ACCESS THE INDICATOR
• Contact me on TradingView or use the links below
-----------------
Disclaimer
Copyright by Zeiierman.
The information contained in my scripts/indicators/ideas does not constitute financial advice or a solicitation to buy or sell any securities of any type. I will not accept liability for any loss or damage, including without limitation any loss of profit, which may arise directly or indirectly from use of or reliance on such information.
All investments involve risk, and the past performance of a security, industry, sector, market, financial product, trading strategy, or individual’s trading does not guarantee future results or returns. Investors are fully responsible for any investment decisions they make. Such decisions should be based solely on an evaluation of their financial circumstances, investment objectives, risk tolerance, and liquidity needs.
My scripts/indicators/ideas are only for educational purposes!

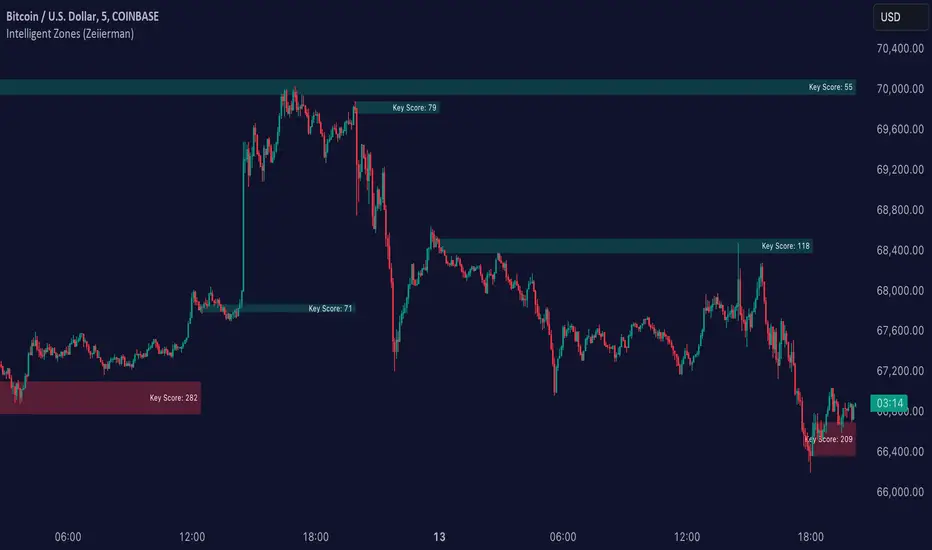
Intelligent Zones (Expo)Intelligent Zones - (Expo)
DESCRIPTION
Intelligent zones is a real-time based indicator that creates colored zones that can act as support or resistance levels. These zones that are painted on the graph are important levels that the future price will react too.
Generally, strategy:
--> If the price crosses up from the cloud it can be considered as a positive “breakout” and the price will most probably continue in that direction.
--> If the price crosses down from the cloud it can be considered as negative “breakout” and the price will most probably continue in that direction.
--> If the price is above the black line it can be considered as positive sentiment, and if the price is below the black line it can be considered as a negative sentiment.
--> The indicator comes in 2 versions. The main difference is how the intelligent cloud is calculated. Sensitive or not.
HOW TO USE
1. Use the indicator to identify real-time market zones.
2. Use the indicator to visualize breakouts.
INDICATOR IN ACTION
The indicator is best presented live, the graphs below are a good guide.
EURUSD
BTCUSD
BRENT
I hope you find this indicator useful , and please comment or contact me if you like the script or have any questions/suggestions for future improvements. Thanks!
I will continue to work on this indicator, so please share your experience and feedback with me so that I can continuously improve it. Thanks to everyone that have contacted me regarding my scripts. Your feedback is valuable for future developments!
ACCESS THE INDICATOR
• Contact me on TradingView or use the links below
-----------------
Disclaimer
Copyright by Zeiierman.
The information contained in my scripts/indicators/ideas does not constitute financial advice or a solicitation to buy or sell any securities of any type. I will not accept liability for any loss or damage, including without limitation any loss of profit, which may arise directly or indirectly from use of or reliance on such information.
All investments involve risk, and the past performance of a security, industry, sector, market, financial product, trading strategy, or individual’s trading does not guarantee future results or returns. Investors are fully responsible for any investment decisions they make. Such decisions should be based solely on an evaluation of their financial circumstances, investment objectives, risk tolerance, and liquidity needs.
My scripts/indicators/ideas are only for educational purposes!
High – Low Trend Indicator Signal (Expo)High - Low Trend Indicator Signal - (Expo)
DESCRIPTION
This indicator is derived from my previous one called High – Low Trend Indicator (Expo) , but the difference is that this one generates Long signals and detects market changes. These two indicators are intended to be used in the same chart for better accuracy and validation of signals. The indicator is perfectly used to identify pullbacks in positive trends!
HOW TO USE
When a signal appears, consider enter long, or look for confirmation patterns. Such confirmation could be seen in the High – Low Trend Indicator (Expo) when the red cloud disappears or when the black price line crosses out from the red cloud, or when the black price line crosses up over the blue midline.
So,
1. Use the indicator to identify Long signals.
2. Use the indicator to find Entry points in positive trends.
3. Use the indicator to detect market changes.
4. Combine it with High – Low Trend Indicator (Expo).
INDICATOR IN ACTION
The indicator is best presented live, the graphs below are a good guide.
EURUSD
DAX
WALL STREET
GOLD
I hope you find this indicator useful , and please comment or contact me if you like the script or have any questions/suggestions for future improvements. Thanks!
I will continue to work on this indicator, so please share your experience and feedback with me so that I can continuously improve it. Thanks to everyone that have contacted me regarding my scripts. Your feedback is valuable for future developments!
ACCESS THE INDICATOR
• Contact me on TradingView or use the links below
-----------------
Disclaimer
Copyright by Zeiierman.
The information contained in my scripts/indicators/ideas does not constitute financial advice or a solicitation to buy or sell any securities of any type. I will not accept liability for any loss or damage, including without limitation any loss of profit, which may arise directly or indirectly from use of or reliance on such information.
All investments involve risk, and the past performance of a security, industry, sector, market, financial product, trading strategy, or individual’s trading does not guarantee future results or returns. Investors are fully responsible for any investment decisions they make. Such decisions should be based solely on an evaluation of their financial circumstances, investment objectives, risk tolerance, and liquidity needs.
My scripts/indicators/ideas are only for educational purposes!
High - Low Trend Indicator - (Expo)High - Low Trend Indicator - (Expo)
DESCRIPTION
This trend indicator is derived from the highest (High) and lowest (Low). The unique formula enables clarity in trends and fast response to market changes.
Negative trend
The market could be considered to be in a negative trend when the black price line is under the blue Midline and a major red cloud is created. For some markets, the orange- trendline can be switched on to identify the long-term trend in the market. So, if the price line is under the orange trendline the market is in a negative trend.
Positive trend
The market could be considered to be in a positive trend when the black price line is above the blue Midline and close to the upper-line. For some markets, the orange-trendline can be switched on to identify the long-term trend in the market. So, if the price line is above the orange trendline the market is in a positive trend.
The indicator should be used in combination with High – Low Trend Indicator Signal (Expo) to identify market changes.
HOW TO USE
1. Use the indicator to identify trends.
2. Use the indicator to find Entry points in trends.
3. Combine it with High – Low Trend Indicator Signal (Expo).
INDICATOR IN ACTION
The indicator is best presented live, the graphs below are a good guide.
EURUSD
DAX
WALL STREET
EURJPY
GOLD
I hope you find this indicator useful , and please comment or contact me if you like the script or have any questions/suggestions for future improvements. Thanks!
I will continue to work on this indicator, so please share your experience and feedback with me so that I can continuously improve it. Thanks to everyone that have contacted me regarding my scripts. Your feedback is valuable for future developments!
ACCESS THE INDICATOR
• Contact me on TradingView or use the links below
-----------------
Disclaimer
Copyright by Zeiierman.
The information contained in my scripts/indicators/ideas does not constitute financial advice or a solicitation to buy or sell any securities of any type. I will not accept liability for any loss or damage, including without limitation any loss of profit, which may arise directly or indirectly from use of or reliance on such information.
All investments involve risk, and the past performance of a security, industry, sector, market, financial product, trading strategy, or individual’s trading does not guarantee future results or returns. Investors are fully responsible for any investment decisions they make. Such decisions should be based solely on an evaluation of their financial circumstances, investment objectives, risk tolerance, and liquidity needs.
My scripts/indicators/ideas are only for educational purposes!